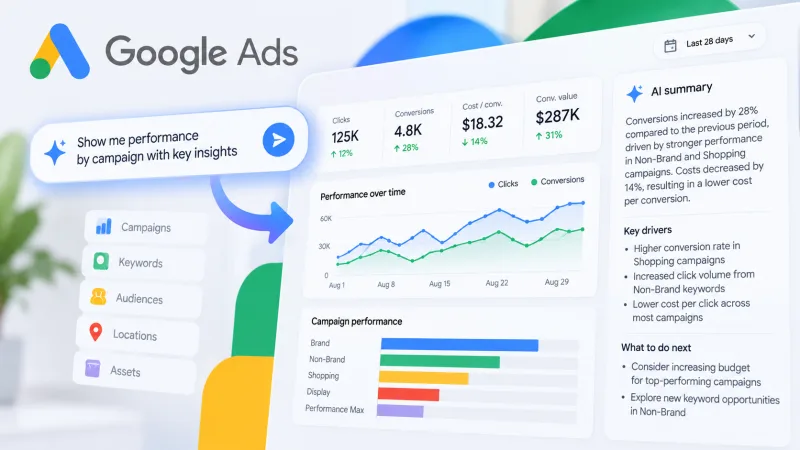
Google Ads AI Dashboards have started appearing in advertiser accounts. The interface accepts text prompts: a specialist describes the report they need, and the system generates a visual representation with an AI-produced summary.
For PPC teams this changes the usual reporting workflow. Previously a specialist had to select metrics manually, assemble tables and configure visualisations. Now part of that work can be handed to a dialogue with the system. The dashboard itself should be treated as an analysis tool, not a replacement for data verification.
What is known about AI Dashboards
The feature appears directly inside Google Ads accounts. That matters in practice: advertisers do not need to switch between the ad platform and a separate visualisation service to pull a basic report.
The mechanics revolve around simple text prompts. A user phrases the task in plain words, after which Google Ads selects a data representation and displays it as a visual report. The system also prepares a text summary.
This approach lowers the threshold for analytics. A specialist does not need to assemble a separate table for every question in advance or manually design report structure. It is enough to describe what needs checking.
AI Dashboards do not turn the ad interface into a standalone analytics system. Available information confirms only that the feature creates visual reports and AI summaries from text prompts. Details about available metrics, rollout sequence and the exact logic behind report generation require verification inside a specific account.
How to use text prompts in practice
The dashboard's usefulness depends on the quality of the task. A prompt that is too general will yield little material for decision-making. The wording should specify what exactly needs comparing or finding.
Instead of 'Show campaign results', better to set a more precise direction: compare campaign metrics over a chosen period or display a visual report for a specific campaign group. Such a prompt gives the system a clear frame.
A practical workflow might look like this: first formulate one question; specify the object of analysis—campaigns, ads or another available slice; describe the comparison needed; check which data ended up in the visual report; cross-reference the AI summary with source metrics in the account.
The last step should not be skipped. The summary is generated automatically, so it requires normal specialist verification. Pay particular attention to the period, chosen slice and the logic of the comparison.
Where the tool will help PPC specialists
AI Dashboards can cut time spent preparing intermediate reports. A specialist receives a question about current campaign performance and phrases it as a text prompt. The system builds a visualisation that is easier to review than a raw set of rows.
This is useful at the initial analysis stage. The dashboard helps quickly see data structure and understand where to direct further checking. After that the specialist can move to ad account details and examine specific campaigns or ads.
In-house teams can also use such reports to discuss results. Visual format makes conversation easier between a PPC specialist and colleagues who do not work inside the Google Ads interface every day. The brief AI summary additionally collects observations into one text block.
But final decisions about budget, offer or creative cannot rest on the automatic summary alone. It may lack sufficient context for a full conclusion. Reasons behind changes in CTR, CPA, ROI or ROAS need checking against source data and campaign launch conditions.
What to verify after the feature appears
First worth noting is the composition of data in the report. It is important to understand which metrics the system used and for what period. Without that, a visually tidy graph can lead to incorrect interpretation.
Then cross-reference the AI summary with figures in the account. If the system reports growth or decline in a metric, check the calculation manually. Separately look whether different campaigns, periods or traffic types have been mixed.
Useful also to assess result repeatability. The same prompt should produce a clear report that can be used in workflow. If the wording is too vague, make it more specific.
Until a stable workflow emerges, better not to transfer such summaries into client reports without additional editorial review. Automatic text may be convenient for initial review, but external reporting requires accuracy and clear interpretation of metrics.
Limitations of AI summaries
The text summary does not know all circumstances of an ad campaign if they are not represented in available data. The system sees metrics and builds visual material from them. It does not replace knowledge about seasonality, offer changes, targeting settings and landing page quality if those factors are not reflected in the report.
There is another problem. Brief text can smooth over important differences between campaigns. Average value across an account sometimes looks stable even though a specific ad group is already losing traffic or conversion. So a general dashboard should be supplemented by checking details.
Limitations are especially visible when working with several sources. AI Dashboards relate to Google Ads data. If a marketer evaluates an ad channel together with CRM, organic traffic or affiliate referrals, one such report will not be enough.
What this means for the advertising market
The appearance of AI Dashboards shows how ad platforms are moving part of analytical work into an interface with text commands. A specialist gets a shorter path from question to visual report.
For daily tasks this may reduce the volume of manual table work. However requirements for analytical thinking do not disappear. One must frame the question correctly, verify chosen data and separate observation from conclusion.
In practice AI Dashboards should be used as a layer of initial analytics. The system quickly assembles a representation of data and formulates a brief summary. Decisions about budget, campaign structure or creative change must rest on verified metrics and the context of the advertising task.
Google Ads AI Dashboards are only beginning to appear in advertiser accounts. Their basic purpose is already clear: a text prompt turns into a visual report with an automatic description of results. Further value of the tool will depend on what data is available to a specific user and how accurately the system interprets the prompt.


